Explore Our Work
OUR FOCUS AREAS
Educator Pipeline Research
Educator Workforce Profiles
Educator Working Conditions
Teacher Exit Survey
District Support Resources
SC-CENTRIC SURVEYS
Administrator Working Conditions
Teacher Exit Survey
Teacher Working Conditions
OTHER INITIATIVES
Litmus Policy Solutions
LATEST RELEASE
Access Resources
FEATURED WORK
DISTRICT RESOURCES
Current Survey
District Landscape
District Support Resources
Toolkits
OUR RESEARCH
Data Ecosystem
Report Library
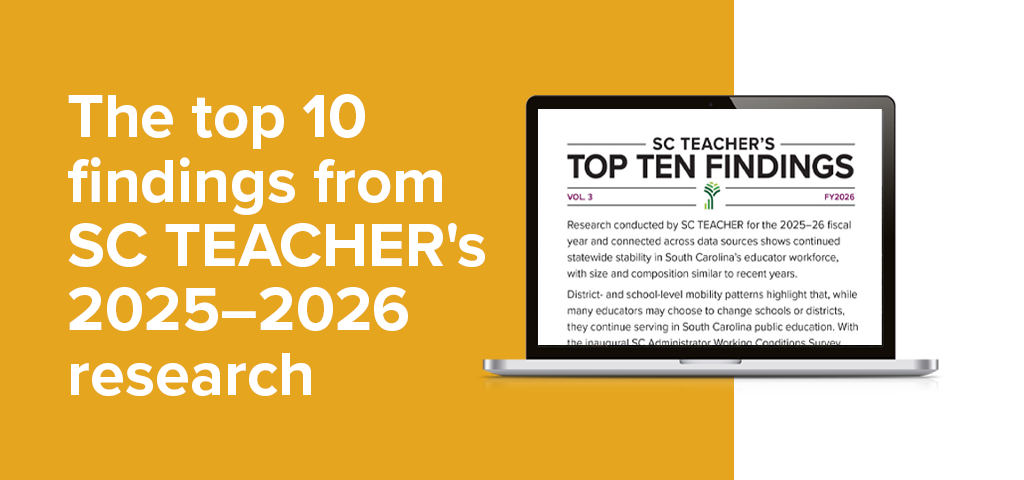
Top Ten Findings | FY26
Glossary
Discover Who We Are
Our Purpose
Our Team
Get Connected
Contact Us
Follow Us On Social
Monthly Newsletter
Search
Privacy Preference Center
Privacy Preferences
CLOSE
CLOSE
NEWSLETTER SIGN-UP
"
*
" indicates required fields
Name
*
Dr.
Miss
Mr.
Mrs.
Ms.
Rep.
Sen.
Other
Prefix
First
Last
Other Title:
Email
*
Current Role
Education Association
Education-focused Organization
Institution of Higher Education
PK-12 Classroom Professional
PK-12 District Administrator
PK-12 School Administrator
Policymaker/Legislative Staff
State Agency
Other
Other Role:
×
×